
| 
|
|
|
|
|
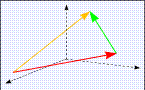
Function and graph
is a dynamical diagram that ilustrates the connection between the
notion of a function as a mapping and its geometrically intuitive
representation as a curve in the plane.
It is also suitable as a repetition before introducing the derivative
(see the applet
On the definition of the derivative).
The applet is started from the red button in its own window. Suggestion for the classroom to this applet: - Function and Graph (by Karinna Huber, Word document) - Algebra II Internet Lesson - Functions (by Susan Socha, Word document) Supplement: Our collection Graphs of simple power functions shows the graphs of the most important powers of a variable. Suggestion for the classroom to this learning unit: - Graphs of simple power functions (by Karinna Huber, Word document) |
| The applet Recognize functions 1 shall support the understanding of how the rules for the graphs of simple polynomial functions (in particular "1st order -> straight line, 2nd order -> parabola") emerge on the basis of algebraic properties (such as the sign of the leading coefficient oder the values of the zeros). In a puzzle type game, a set of given functional expressions and graphs shall be associated with each other. The functions may thus gain a little bit of "sensual quality". The applet is started from the red button in its own window. |
|
In the applet Recognize graphs 1,
a puzzle type game, the goal is to recognize the functional expressions
corresponding to a set of given graphs.
All functions involved are
polynomials of at most second order,
i.e. functions of the form
a x2 + b x + c.
The applet is started from the red button in its own window. Also visit the big function graph puzzle of the interactive tests section, which chooses out of more than 100 graphs of linear und quadratic functions by random and evaluates the success achieved. |
|
Polynomial of third order (cubic polynomial)
is an applet displaying the graph of the function
f(x) = a x3 + b x2 + c x + d
after numerical input of the coefficients
a,b,c,d.
The coordinates of the cursor position are shown. This admits the
approximate solution of second and third oder equations.
It is started from the red button in its own window.
It is designed for Netscape Navigator 4
and Microsoft Internet Explorer 4.
In Netscape Navigator 3, considerable delay may occur. |
 The Function plotter
is a useful tool for many purposes.
You may enter arbitrary functional expressions,
look at the correspondig graphs, and zoom in and out.
The plotter provides brief orientation about
the form of graphs, as well as high accuracy determination
of the position of interesting points (like zeros
of a function or intersection points of graphs).
Clicking the red button calls a
web page in a separate browser window,
within which the applet is started.
The Function plotter
is a useful tool for many purposes.
You may enter arbitrary functional expressions,
look at the correspondig graphs, and zoom in and out.
The plotter provides brief orientation about
the form of graphs, as well as high accuracy determination
of the position of interesting points (like zeros
of a function or intersection points of graphs).
Clicking the red button calls a
web page in a separate browser window,
within which the applet is started.
|
|
Gallery - Table of contents Maths links: online tools topics collections Welcome Page |